Research-Driven.
A complex and ever-changing investment landscape provides challenge and purpose for our team.
Our Thoughts on the Credit Markets
February, 2024 | Rich Johns & Tanner Baker
Our Thoughts on the Credit Markets
The Federal Reserve (“the Fed”) drove most of the market action in 2023. In late July, the Fed paused its most aggressive interest rate hiking campaign in history, resulting in the highest target fed funds rate in over 20 years (5.25% - 5.50%). This left the market engulfed in uncertainty, questioning whether this was merely a pause on the way to even higher rates or if the Federal Reserve had accomplished its mission of curbing inflation. Markets fell until dovish Fed language at its October 31st – November 1st meeting, which strapped a rocket booster to both stocks and bonds for the final two months of the year. The S&P 500 Index finished the year up 26.3%, largely driven by the Magnificent 7 and their potential for breakthrough AI applications. The Bloomberg U.S. Aggregate Index was up 5.5%, partially recovering from its drubbing in 2022 when it declined -13.0%, its worst year ever.
2023: A Tale of Two Markets
Credit market performance in 2023 was a tale of two markets with the demarcation being the late October Federal Open Market Committee (“FOMC”) meeting. Before the October meeting, the “dot plot” (a visual representation of the individual FOMC members’ projections of the path of future fed funds rates) showed ten of the nineteen FOMC members projecting rates above 5% at the end of 2024. By December, only three of the nineteen participants maintained the same view.
Although Federal Reserve Chair Jerome Powell held open the possibility of other increases in future meetings, the market quickly priced in a series of cuts in 2024. Down -2.8% through October, the Bloomberg U.S. Aggregate Index was on pace to make history by recording its third consecutive negative year before abruptly changing course to post its strongest November since 1981. Similarly, the S&P 500 generated approximately half its 2023 performance in the last two months of the year.
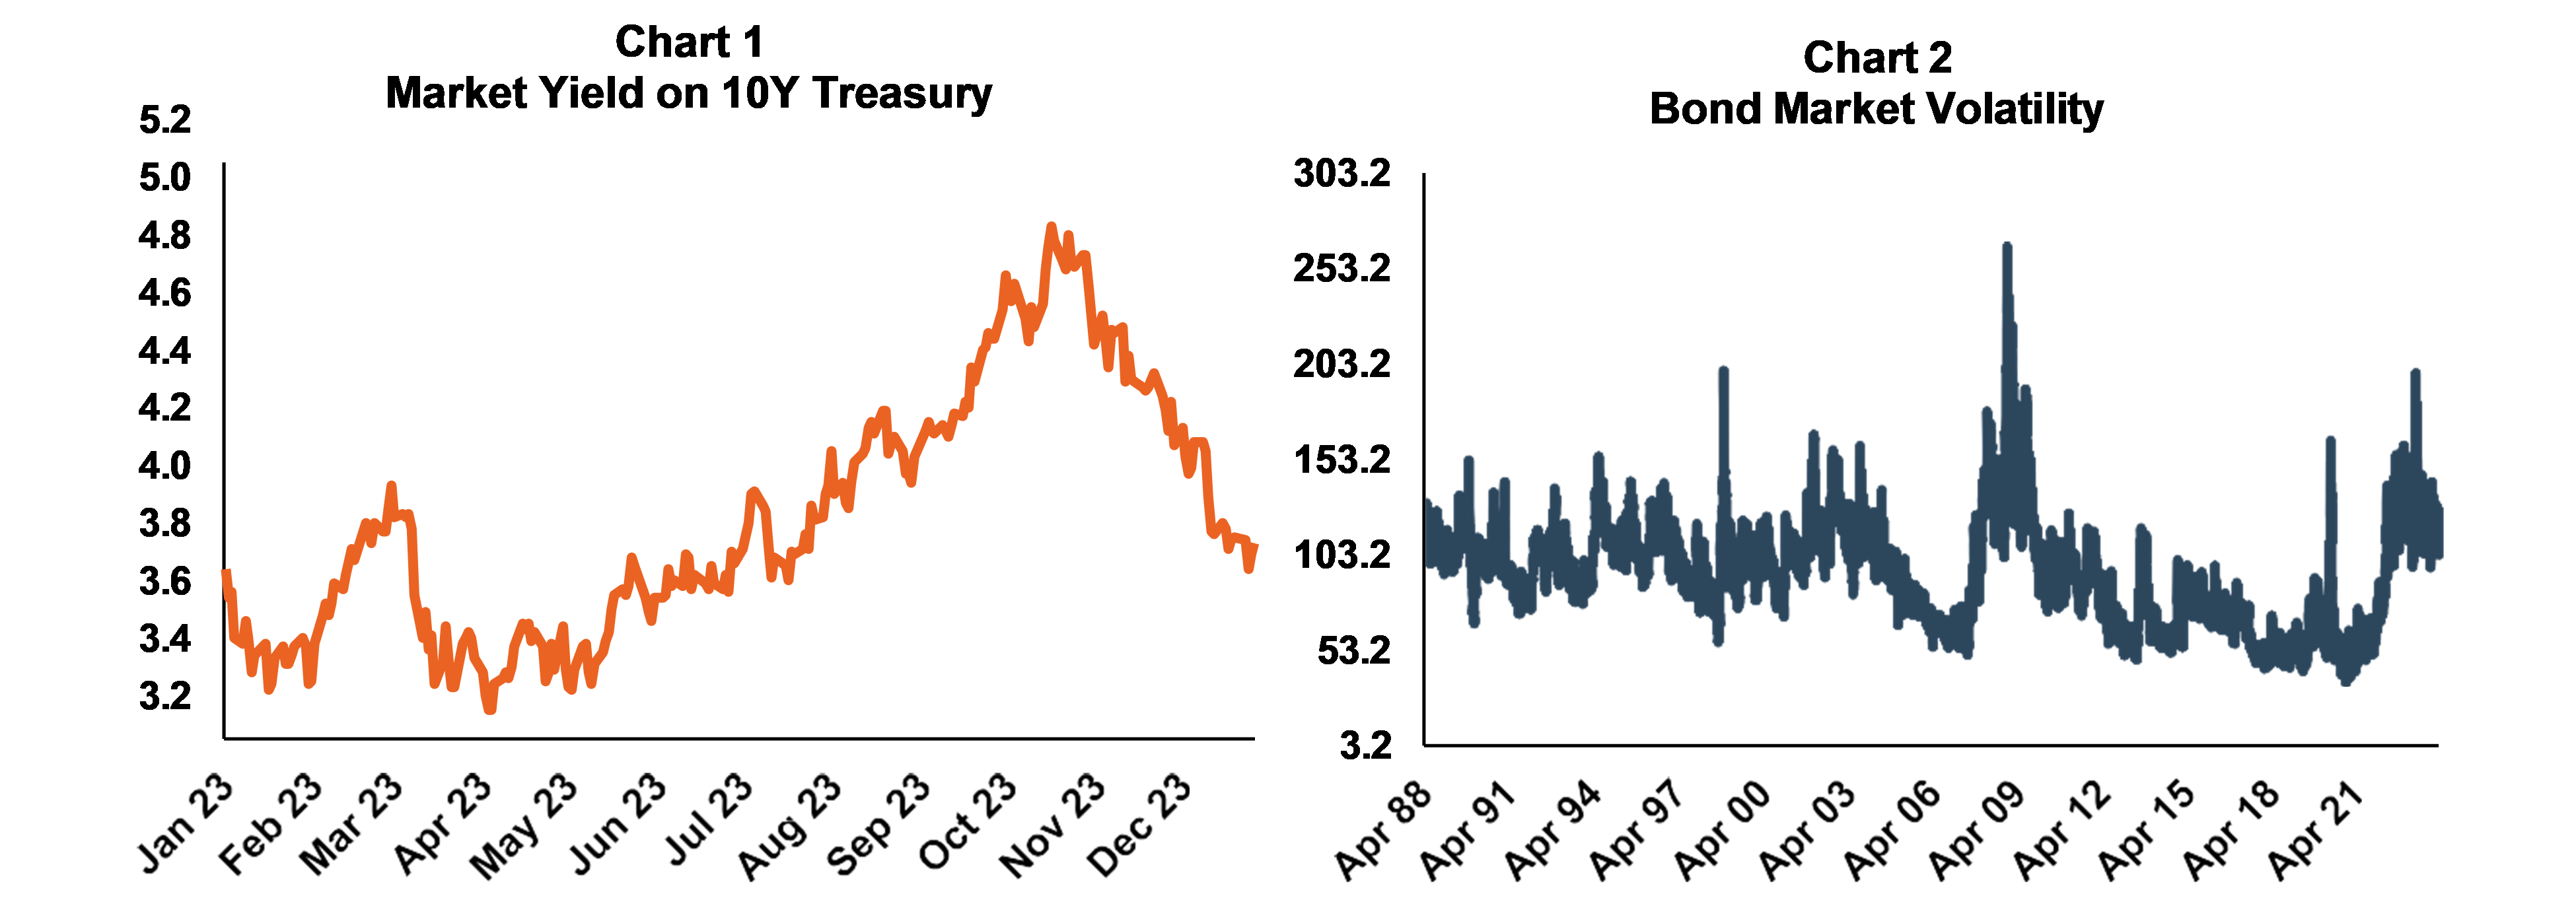
The market yield on 10-Year Treasuries started and ended the year at nearly 4.0% but had wild fluctuations with a trough of 3.3% to a peak of nearly 5.0% (See Chart 1), representing the most volatile bond market since the Great Financial Crisis (See Chart 2).
In the initial months of the year, amid widespread recession predictions by most Wall Street strategists, credit spreads peaked at 520 basis points. Throughout the course of the year, spreads remained elevated until the Fed’s dovish messaging at the late October meeting. This led to a subsequent collapse to 330 basis points, giving little excess yield to investors in the riskiest corners of the credit markets.
2024: Are We Out of The Woods?
At the onset of 2023, prevailing investment sentiment was universally dour. However, the year concluded with a notable shift towards optimism driven by the hope for significant rate relief from the Fed. Despite this optimism, the spread between the 10-Year and 3-Month U.S. Treasury yields (a 2018 paper by the Federal Reserve Bank of San Francisco found this indicator was the most useful recession forecasting tool) has remained inverted for the longest time in history and reached its steepest inversion in May.
Helping explain why we have yet to see the recession predicted by the inverted yield curve is the concept of the “long and variable lag,” introduced by economist and Nobel laureate Milton Friedman in his 1960 book A Program for Monetary Stability. His research references the considerable amount of time before interest rate hikes have their full impact.
Data from Credit Suisse shows that a recession typically hits 22 months after the yield curve inversion. According to J.P. Morgan, a recession usually takes place at least seven quarters after the initial Fed hike. Lastly, a recession has started three to 18 months after the Fed finishes raising rates in six of the last seven rate hike cycles. All three indicators point to the possibility of recession in 2024.
In addition to the market indicators discussed above, the consumer is starting to show signs of strain, with the most susceptible individuals facing conditions resembling a deep recession. This is significant because consumer spending accounts for more than two-thirds of U.S. GDP, making it by far the largest component of the economy.
One startling statistic indicates delinquency levels in subprime auto loans have surpassed the peak observed during the 2008 Great Financial Crisis. Car payments typically occupy a crucial position in consumers' monthly payment priorities given the essential role of automobiles in commuting to work. Thus, in times of financial distress, car payments tend to be among the last obligations defaulted upon.
It is not only the most vulnerable consumers showing strain. According to data from LendingClub, approximately two-thirds of U.S. consumers were living paycheck-to-paycheck at the end of 2022, including more than four in ten high-income consumers. Further, higher earning cohorts are increasingly vulnerable to financial stress given their lack of savings and home ownership versus prior generations. Data on the intergenerational distribution of wealth (measured by home ownership, consumer durable goods, investments, defined benefit plans, defined contribution plans and private businesses) from the Federal Reserve reveals that Millennials have less than half of the wealth that Boomers had accumulated when they were the same age as Millennials are now.
Given the lack of buffer that accumulated wealth provides, more recent generations’ level of spending is much more brittle than that of their parents and grandparents and could contribute to a rapid onset of a consumer-led recession even if there are relatively mild job losses.
February 2024
Rich Johns & Tanner Baker